Summary Tables#
Summary tables are the workhorse of data analysis in Grist. They are similar to “pivot tables” in
spreadsheets, and to GROUP BY clauses in databases. They let you get table-wide totals or any
subtotals.
Summary tables have many uses:
- Group projects by status, or by priority.
- Summarize bank transactions by year, or quarter, or by category.
- Group employees by position, or gender, or department.
- Summarize by any combination, such as position and gender and department.
- Group all records to calculate table-wide totals and statistics.
Adding summaries#
Click “Add New” button and select “Add Page” or “Add Widget to Page”. In the widget picker, click the summation icon () next to the table you’d like to summarize.
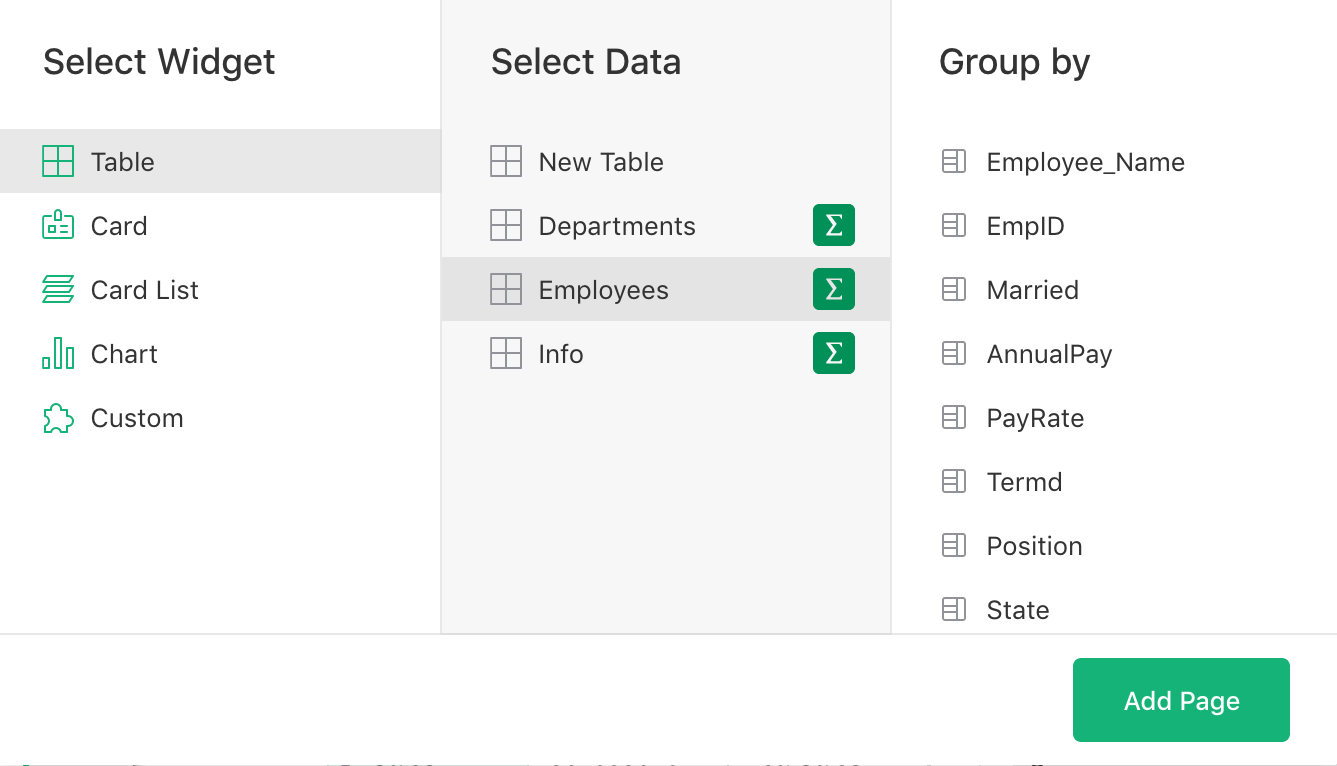
When creating a summary table, you choose a field or a combination of fields by which data should be grouped. These are called the “Group by” fields. The summary table will contain one row for each group-by value. For instance, if “Position” is selected as a group-by field, the summary table will contain one row for each job position.
Grist’s powerful formulas then allow arbitrary calculations on the matching subsets of the underlying data.
Keep in mind that the group-by fields determine which groups should exist in the summary table. Do not select values you’d like to calculate (e.g. for average salary) as group-by fields; these will be created using formulas in the next step.
Tip: You can think of rows in a summary table as buckets into which your records will be placed. Group-by fields determine the labels for these buckets. For instance, a summary of projects grouped by status (e.g. “Active”, “Completed”, “NotStarted”) will have three such buckets, one for each status. Every project goes into one of these three buckets. You can then easily calculate info for each folder, such as a count of projects or the total of their costs.
Summarizing by year, quarter, month, or week#
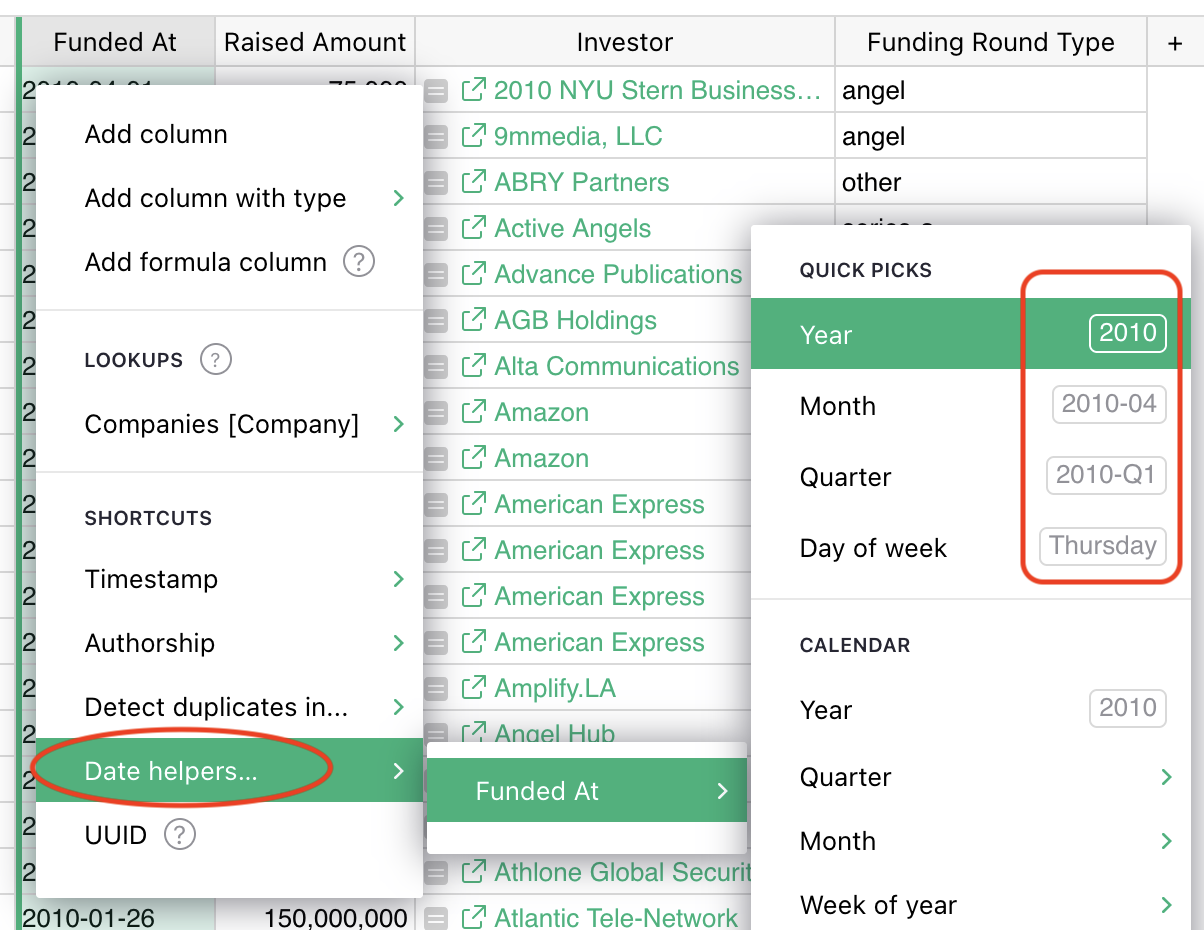
If you have data with dates, it’s common to want summaries by a date period like year, quarter, month, or week. To do that, you should add a column to your underlying table that extracts the relevant date period from your date column.
Grist offers a handy shortcut for this. When adding a column, you’ll see an option ‘Date helpers…’, which lets you pick any column of type Date or DateTime in your data, and for that column, which period to extract:
See Working with dates for more options.
Once you’ve added such a column, simply select it as a ‘Group by’ field when creating a summary table.
Summary formulas#
When you add a summary table, each of the selected group-by fields becomes a column in the new table. Everything else in the summary table is calculated using formula columns. Some of these columns are created automatically, as a convenience.
Specifically, a column count will be added to show the number of records in the group
represented by the current summary row. And for any numerical column in the original data, the
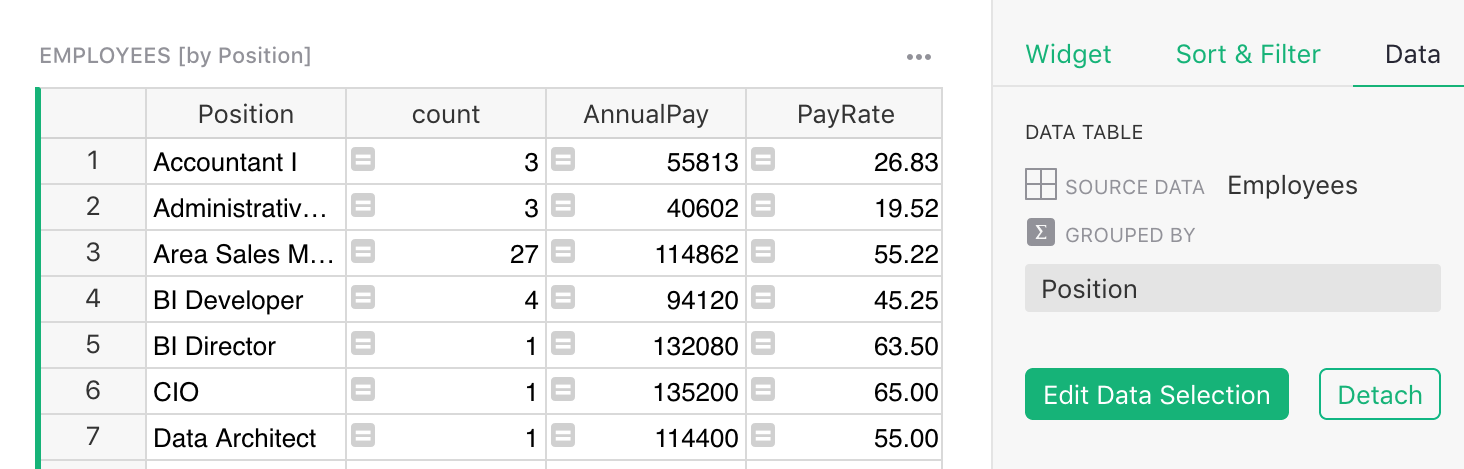
summary table will contain a same-named column with the total. For instance, the summary of
Employees grouped by Position would look like this:
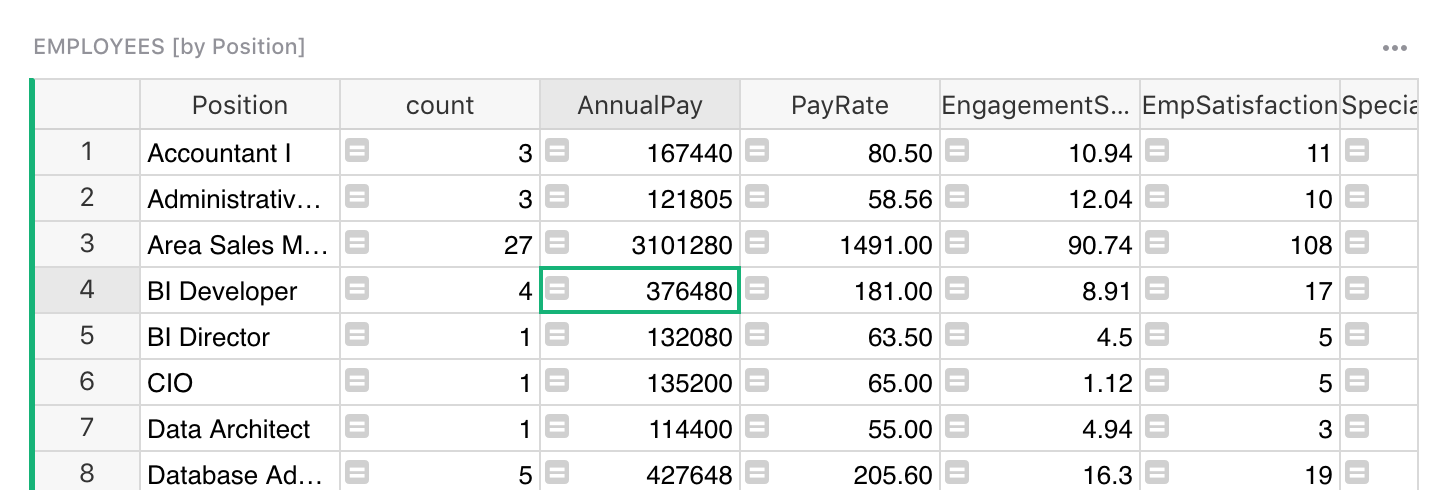
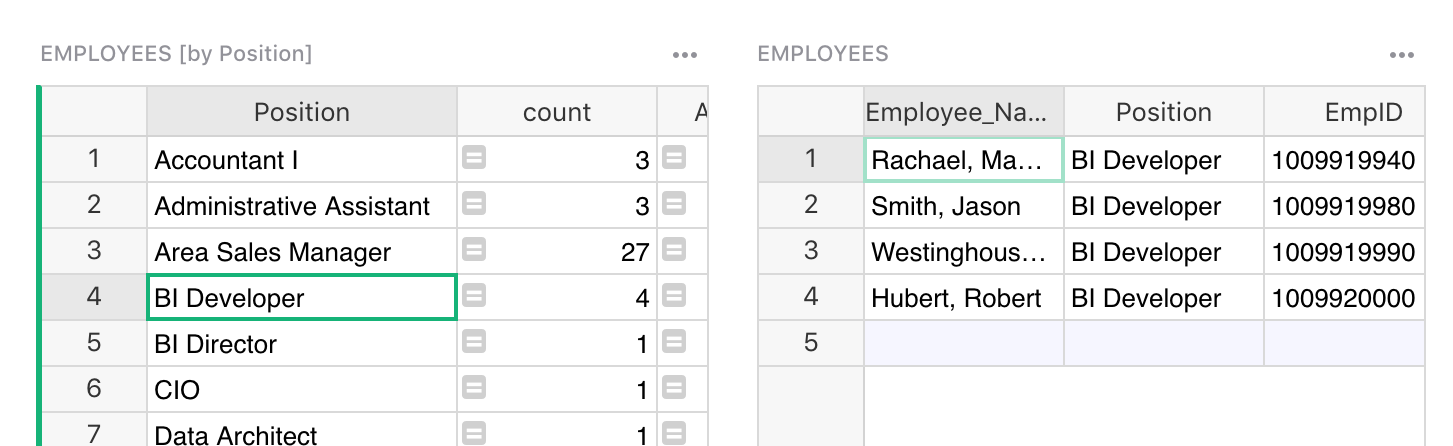
Tip: A summary widget will have a header like “EMPLOYEES [by Position]”, to
indicate that it’s showing summary data for the Employees table, grouped by “Position”. You
can click the title to rename it.
If you select a cell in a column like count or AnnualPay and hit Enter, you’ll see the formulas that calculate them:
countislen($group)AnnualPayisSUM($group.AnnualPay)
The mysterious $group is simply another column, hidden by default (but you may unhide it). It contains for each cell the group of records represented by this summary row.
Side note for Python fans.
$group is a special Python object. It’s an iterable collection of records. Using an
attribute like $group.A is a shorthand for the list of values in the A column of all the
records in the group, similar to [r.A for r in $group].
If you unhide this column, it will show as a python list of numeric row IDs which identify the records in the group.
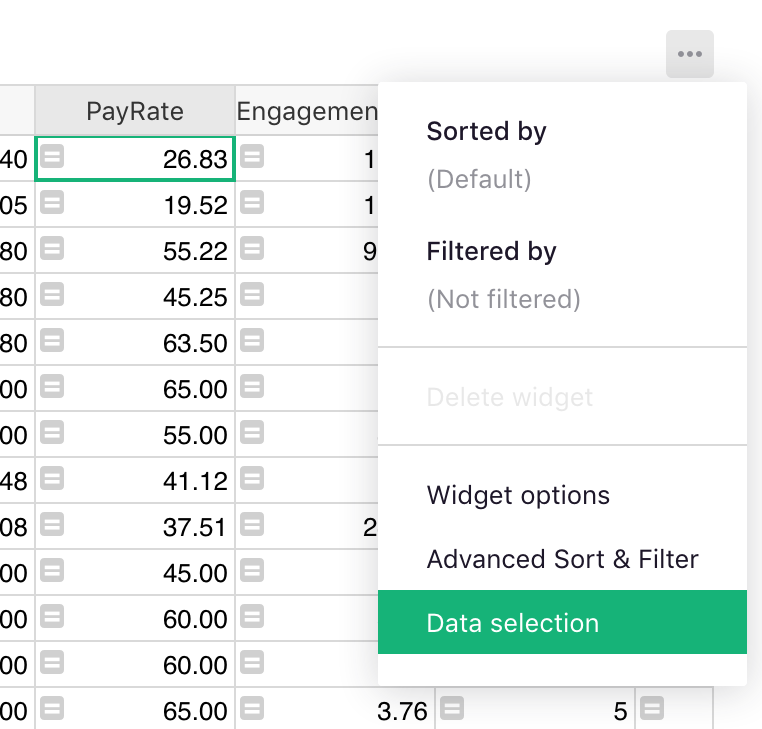
Sometimes the automatically created columns don’t make sense. For instance, the sum of PayRate
isn’t very meaningful. Simply delete such columns, either using the column menu or
using the Alt + Minus keyboard shortcut.
You are free to change formulas for the automatically created columns, or to add new formula columns. Note that summary tables do not allow adding non-formula columns.
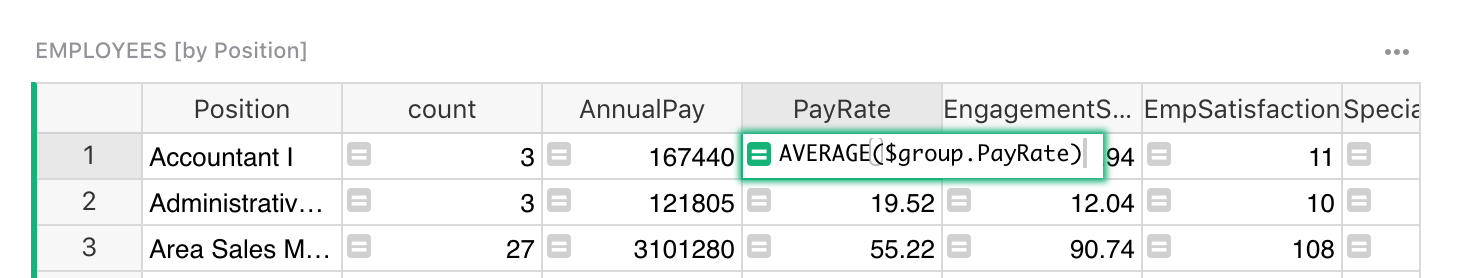
For instance, you might want to change the formula for PayRate from SUM($group.PayRate) to
AVERAGE($group.PayRate), which would be a more interesting value.
Here are some useful recipes of formulas in summary tables:
- Average:
AVERAGE($group.PayRate)orSUM($group.PayRate) / $count - Standard deviation:
STDEV($group.PayRate) - Maximum or minimum:
MAX($group.PayRate),MIN($group.PayRate) - Sum over a subset of records:
SUM(r.AnnualPay for r in $group if r.EmploymentStatus == "Active") - Weighted average:
AVERAGE_WEIGHTED(zip($group.Life_Expectancy, $group.Population))
In fact, you may use the full power of Python to calculate what you’d like. As for any table, your
formula may refer to any of the columns in the summary table, not only $group.
Changing summary columns#
The group-by columns in a summary table are created when you add the widget. It’s not possible to modify the values in them, or to modify their settings, such as type. The settings and values of the group-by columns reflect those in the underlying table. When new values appear in the underlying table for the group-by columns, the summary tables will also get new rows automatically.
What you may change is which columns the table is grouped by. Click the three dots on the top right of the summary table, and click “Data selection”:
The settings in the side pane tell you which data is shown and how it’s grouped:
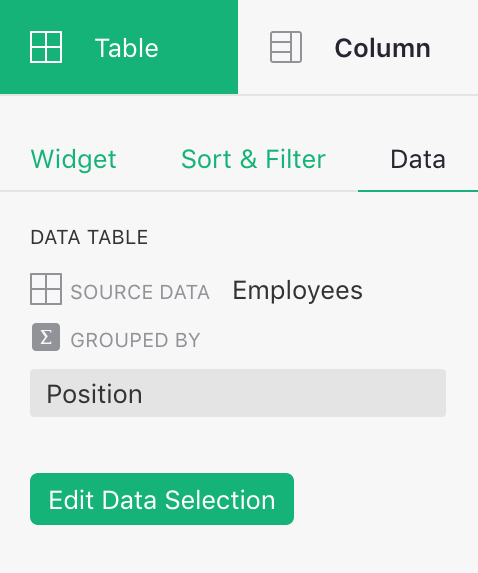
You can click “Edit Data Selection” button to open the same widget picker that you used to add the summary table. You can now deselect some “Group by” fields and select others, and click “Save” to update the summary table.
Linking summary tables#
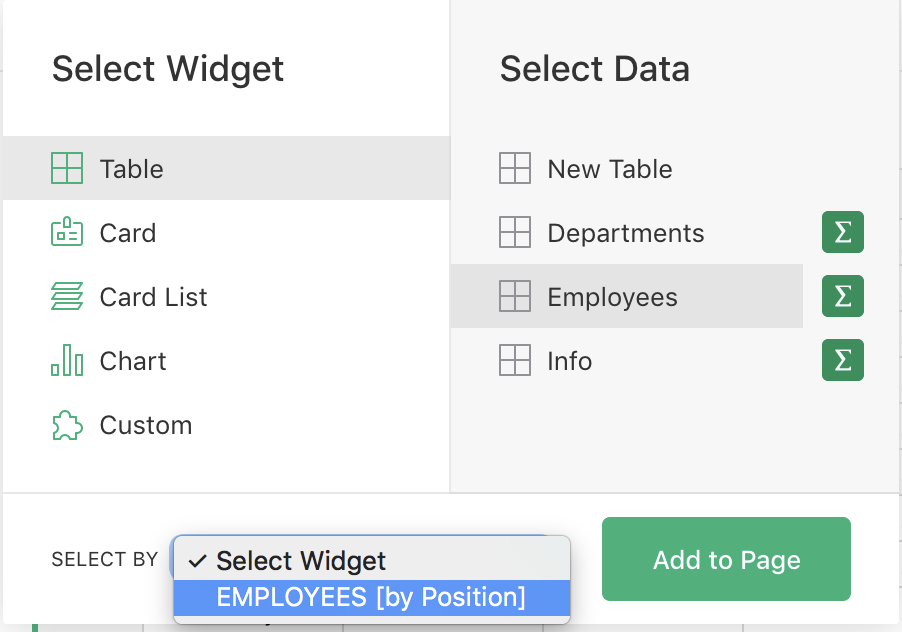
You can link summary tables to other widgets. If you have a summary table on a page, it can be used as a selector for a table of underlying data, or for a more detailed summary.
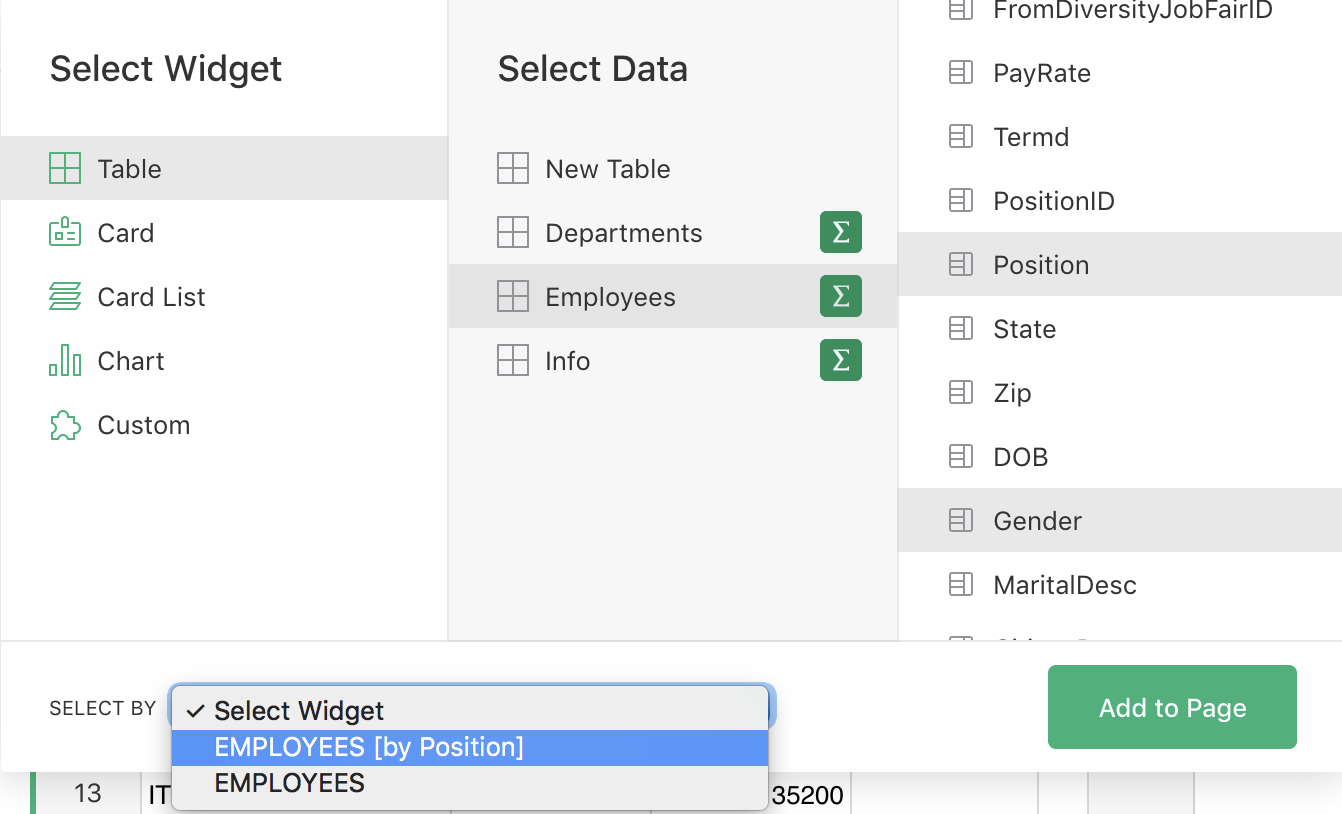
For example, if you have a summary of Employees by “Position”, it will be available as a “SELECT
BY” option when adding an unsummarized table of Employees:
The result is that you can select a position in the summary table, and see all employees in that position.
You could similarly link a summary of Employees grouped by “Position” and “Gender” to the first widget:
You can then select a position in the “Employees [by Position]” widget, and see a breakdown by gender among the employees in that position.
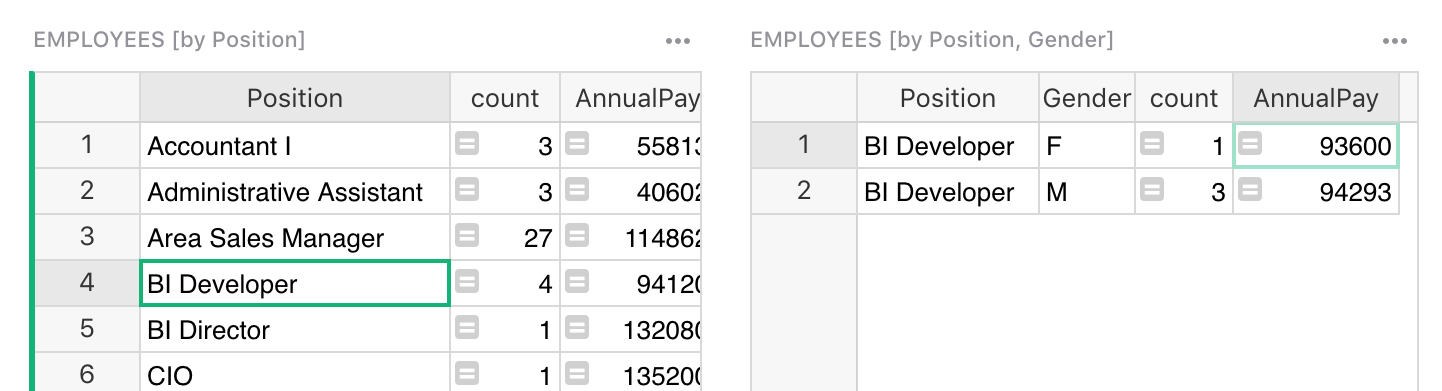
Note that such linking requires the new widget to include both “Position” and “Gender” in its group-by columns.
For more about linking, see Linking widgets.
Charting summarized data#
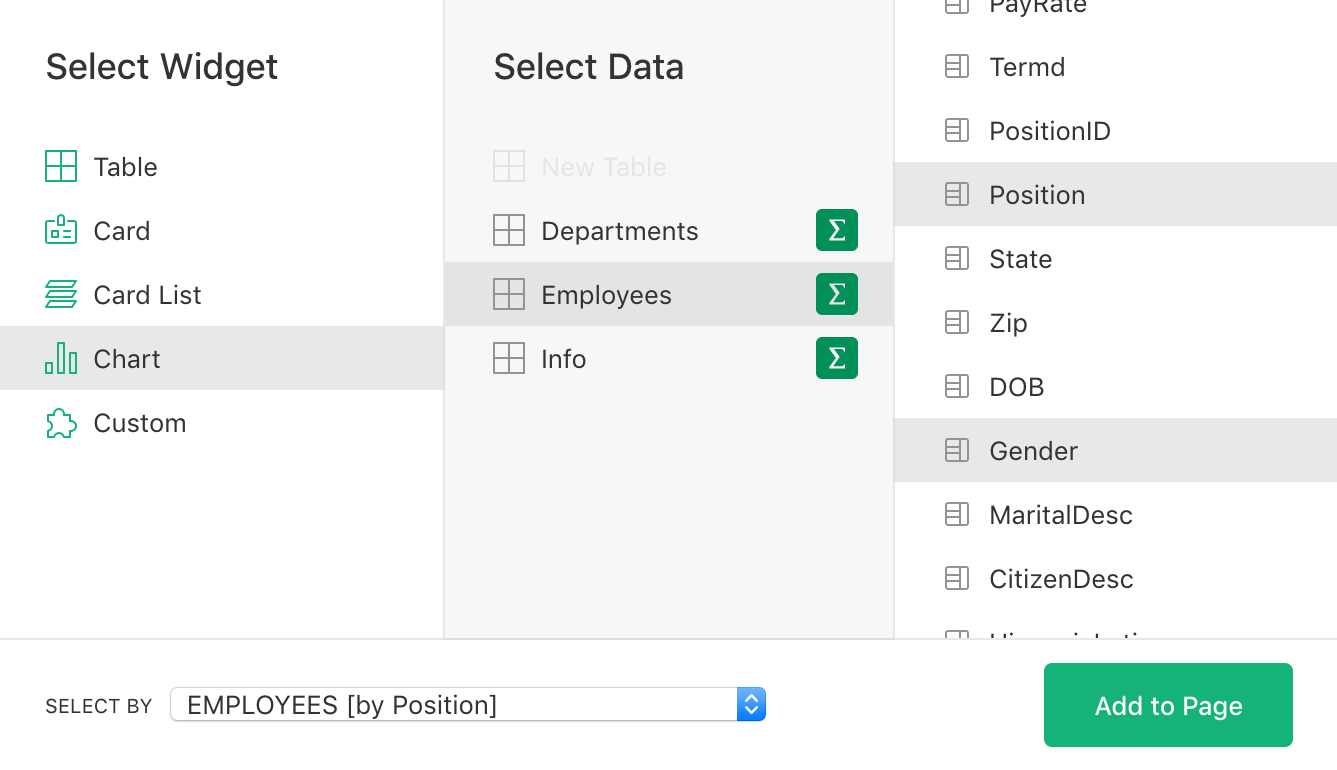
Summary tables are a great source of data for charts, including dynamic charts. In the example
above, we could add another widget showing Employees grouped by “Position” and “Gender”, but
this time in a Chart widget.
Select “Bar Chart” for the chart type, and select “Gender” and “AnnualPay” as Visible Series. You can now click on a position, and see visually the gender difference in average salary for this position.
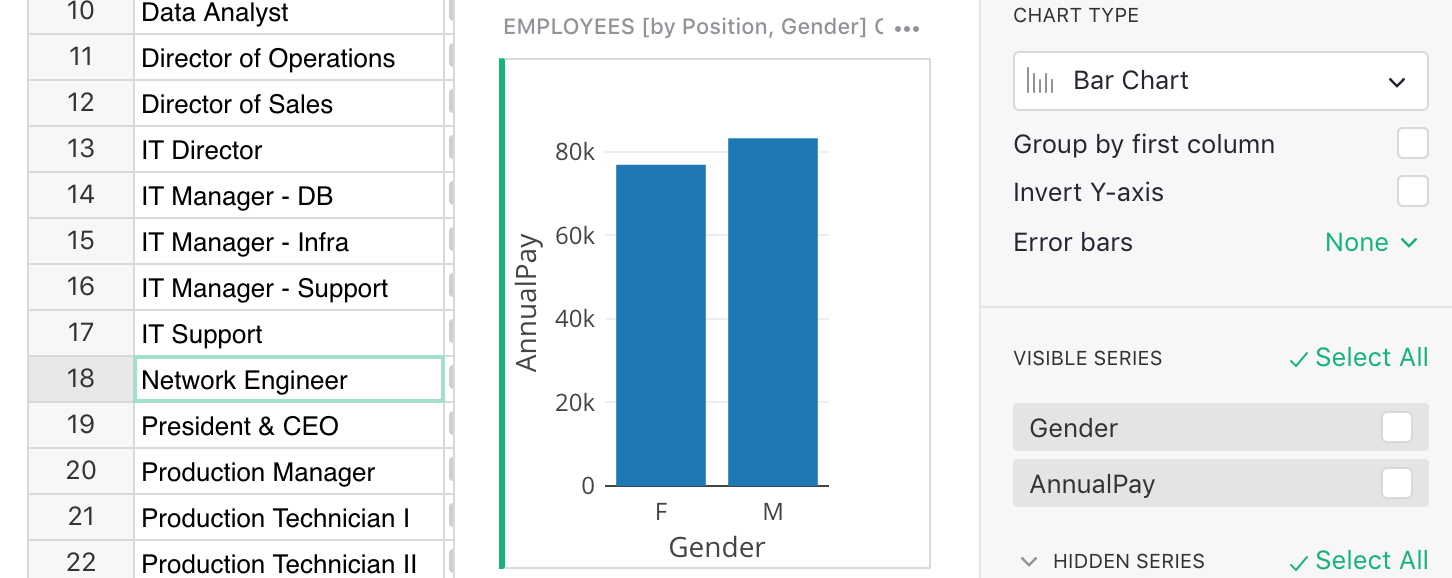
The Analyze and visualize tutorial shows other examples of charts based on summary tables.
Detaching summary tables#
Summary tables are computed from underlying data. Sometimes, however, its useful to “detach” a summary table and turn it into an independent data table.
For example, we’ve seen how to summarize a table of Employees, grouping it by the column
“Position”. Let’s say you want to associate some data with each position, such as a job
description, or a workers compensation insurance code. Such data belongs in its own table,
with one row for each position, and a few columns.
Summary tables provide an easy way to create such a table. Add a page with a summary of
Employees grouped by “Position”.
Now, in the right panel’s “Data” tab, click the “Detach” button.
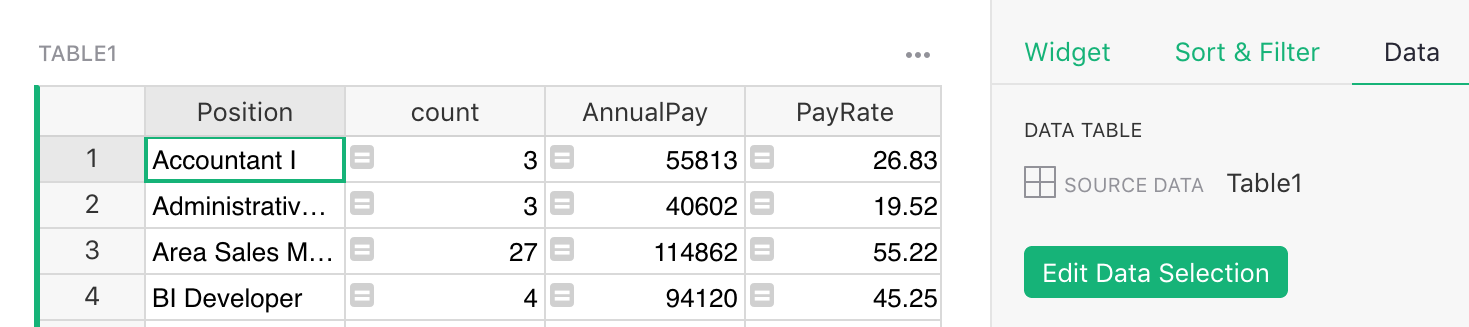
Your summary table just got turned into a brand new table with the same rows and an auto-generated name, like “Table1”. You can rename it to “Positions”, and add the columns you need:
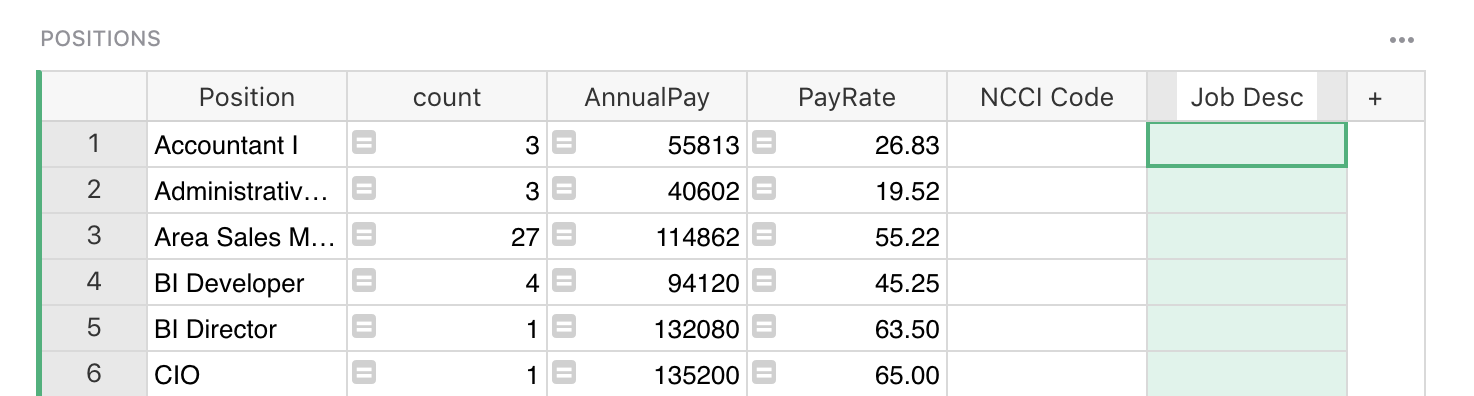
The calculated columns remain. In fact, anything you could calculate about each position in the “Employees [by Position]” summary table, you may still calculate in the new “Positions” table.
One difference is that new values will not get added to the detached table automatically. In other words, if a never-before-seen position (perhaps “Chief Troublemaker”) appears in the underlying data, a summary table would update automatically to include it, but a detached table will not.